ETH
crypto
staking
ETHEREUM (ETH) STAKING INSIGHTS & PROTOCOL ANALYSIS: ANNUAL 2025 | 2026 OUTLOOK | EVERSTAKE
Explore Ethereum's 2025 annual staking report. Key protocol upgrades (Pectra, Fusaka), record institutional adoption via ETFs and DATs, validator consolidation with MaxEB (EIP-7251), and comprehensive 2026 outlook.
JAN 26, 2026
Table of Contents
Key insights & takeaways
Structural shifts: protocol upgrades and organizational changes
On-chain performance: settlement, scaling, and supply
Staking ecosystem: structural maturity & market segmentation
The financial layer: RWA and stablecoins
Ethereum in Global Finance: DATs, ETFs, and Corporate Adoption
The price of maturity: centralization risks and economic identity
Everstake's strategic partnerships and ecosystem milestones
The road ahead: 2026 upgrades, institutional growth and quantum resilience
The new standard for institutional staking
Quantum resistance: what it is and why it matters
Conclusion
Share with your network
Key insights & takeaways
-
2025 saw a mix of technological triumph (upgrades) and record institutional adoption (ETFs, DATs), alongside macroeconomic headwinds and price stagnation for ETH.
-
Pectra introduced EIP-7251 ("MaxEB"), increasing the maximum effective validator balance from 32 to 2048 ETH. Fusaka activated PeerDAS (EIP-7594), a key data-availability sampling technology that alleviated the data bottleneck and safely increased L2 blob throughput by up to 8x.
-
The Ethereum Foundation executed a strategic reorganization of its Protocol R&D division, realigning the department's focus toward client diversity, formal verification, and zkEVM security frameworks.
-
Layer 1 transactions grew by ~30% (to 1.5–1.6 million daily) despite L2 expansion. The L2 ecosystem's aggregate transactions per second (TPS) surpassed 300–330, scaling Ethereum's base layer (15 TPS) by a factor of ~20.
-
Total Value Staked reached ~36.08 million ETH (29.3% of total supply), with net growth of over 1.8 million ETH. The adoption of the MaxEB (EIP-7251) limit was explosive, with consolidated validators (over 32 ETH) growing from 2% to over 11% of all staked Ether in six months.
-
A new sector of public companies (DATs) accumulating Ethereum emerged, leading to a "hockey stick" trajectory of corporate holdings, breaching 6.5–7 million ETH by December 2025.
-
The Prysm Outage in December 2025 (validator participation dropped to ~75%, 248 blocks missed) vividly demonstrated the risk posed by stakers, including institutional players, herding towards a single Consensus Client.
2025 was a year of sharp contrasts for Ethereum: the technological triumph of the Pectra and Fusaka upgrades coincided with severe macroeconomic headwinds, while record institutional adoption via ETFs and DATs sat alongside a paradoxical price stagnation. The ecosystem has matured and irreversibly transformed: the staking market has moved from simple solutions to complex strategies, and the battle for liquidity and users has effectively migrated to Layer 2.
In this report, we research the anatomy of these shifts, analyze why the "Ultrasound Money" narrative has faced an identity crisis, and evaluate how the looming architectural changes of 2026 will redefine the rules of the game for validators and investors.
Structural shifts: protocol upgrades and organizational changes
2025 marked Ethereum's definitive transition from theoretical concepts to a phase of rigid industrial scaling. We saw abstract roadmap items turn into functioning code, permanently altering validator economics and user experience through two key upgrades: Pectra and Fusaka.
Pectra
The Pectra (Prague-Electra) upgrade, activated in the spring, laid the foundation for the network's operational efficiency.
-
Key Achievement (EIP-7251 "MaxEB"): Increasing the maximum effective validator balance from 32 to 2048 ETH. This allowed major operators to consolidate thousands of small nodes into powerful clusters, significantly reducing the load on the network's P2P layer and cutting operational expenses (OpEx). Crucially, the upgrade drastically reduced the initial slashing penalty from 1/32 to 1/4096 of the effective balance. This means that even a fully loaded 2048 ETH validator now faces a lower initial penalty (~0.5 ETH) than a standard 32 ETH validator did previously (~1 ETH), making consolidation not only efficient but also statistically safer.
-
UX Breakthrough (EIP-7702): The implementation of Account Abstraction elements for standard wallets. Users gained the ability to pay gas fees with tokens and sign batched transactions, which radically improved the interaction experience.
Fusaka
In early December, the Fusaka (Fulu-Osaka) hard fork was successfully activated on Mainnet. This upgrade stands out not just for its technology but for the quality of its execution.
-
Execution: breaking the cycle. Fusaka was perhaps the first major upgrade in modern Ethereum history to launch on schedule, without constant delays. This signals maturity in governance processes: developers have stopped trying to "cram everything in" and shifted to a clear, deadline-oriented approach.
-
Key Technology: PeerDAS (EIP-7594). If Pectra optimized consensus, Fusaka solved the data "bottleneck."
-
PeerDAS (Data Availability Sampling): The core of the upgrade. This technology changed how nodes verify data: instead of downloading full, heavy "blobs" (L2 data containers), nodes now verify only small random samples.
-
Real Impact: This allows for a safe increase in blob throughput by up to 8x. For L2 networks (Arbitrum, Base, Optimism), this means abundant Data Availability, keeping fees at fractions of a cent even during peak loads. This is enabled by EIP-7892: Blob Parameter Only Hardforks, which allows developers to raise throughput limits (target/max blobs) via lightweight configuration updates, enabling flexible reaction to demand without complex hard forks.
Still, a crucial yet often overlooked change was the implementation of EIP-7918.
-
Previously, the blob price could drop to 1 wei, making L2 data storage effectively free and yielding no revenue for the network.
-
This EIP established a dynamic floor price for the blob base fee. Now, the price does not fall to zero but remains at an economically rational minimum. This protects the network from spam and returns value to ETH holders via the burn mechanism, even when blocks are not 100% full.
Ethereum Foundation
In 2025, the Ethereum Foundation carried out a major restructuring of its Protocol division, focusing on strengthening network resilience.
-
Protocol R&D Reorganization: The division was reorganized into dedicated teams (Scale L1, blob/data, UX, etc.) with designated leads to ensure more focused execution across key technical verticals.
-
Formal Verification and zkEVM Security: A significant reallocation of resources toward formal verification, audits, and security initiatives, particularly for zkEVM technologies and adjacent stacks.
-
New Specialized Teams: Dedicated units and programs were established for tooling, verification, and L2 operations to bridge internal competency gaps within the EF.
-
ESP (Grants) Relaunch: The grant model was restructured into a more targeted framework (Wishlist/RFP), prioritizing client diversity, security, and critical infrastructure projects.
-
Operational Readiness: Resilience practices were strengthened through wargames, on-chain tests, and incident response drills to validate upgrades before deployment.
On-chain performance: settlement, scaling, and supply
Transaction count
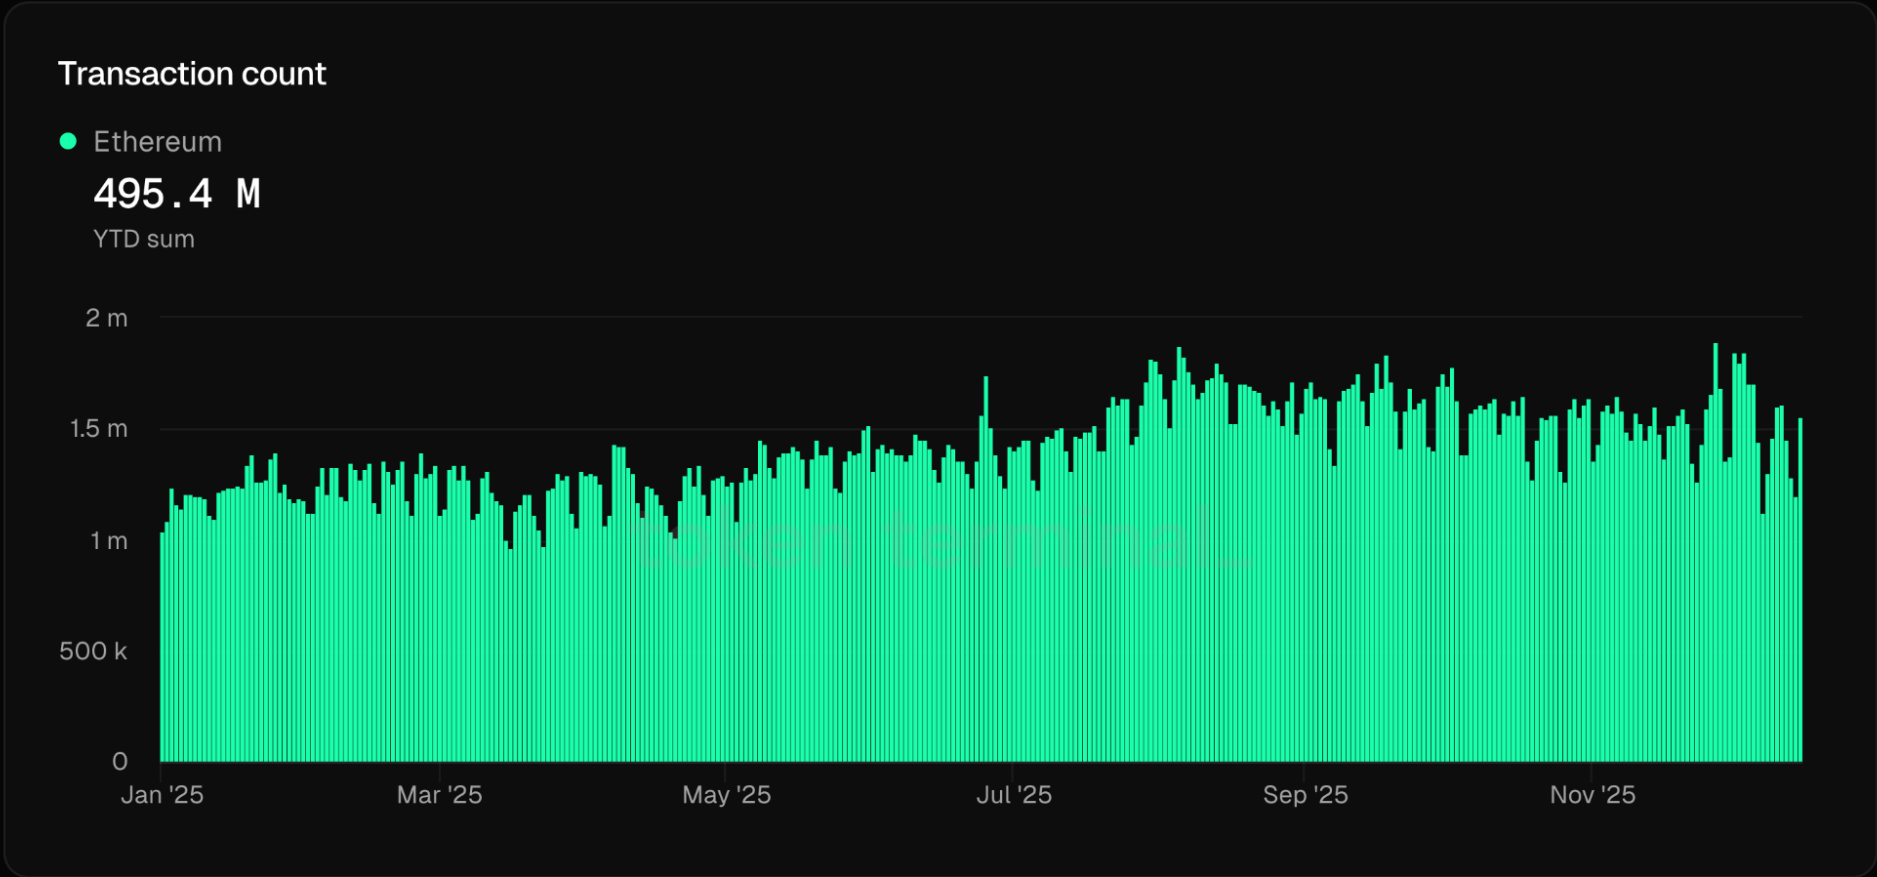
Source: tokenterminal
According to the chart data, activity on the Ethereum Mainnet (Layer 1) demonstrated a sustained upward trend throughout 2025.
-
Start of Year (Q1): Daily average transaction count fluctuated between 1.15 — 1.25 million.
-
End of Year (Q4): The figure grew to 1.5—1.6 million, with peak values of 1.9 million transactions per day in December.
-
Growth: Year-to-Date (YTD) activity growth was approximately ~30%, despite the aggressive expansion of L2 networks.
The growth of L1 transactions during the era of L2 proliferation might seem illogical. Still, it confirms the suggestion of Ethereum's transformation into a global Settlement Layer.
-
L2 Settlement Factor: A significant portion of the transactions on the chart are not transfers by regular users (Alice sending ETH to Bob), but rather technical operations by the L2 networks themselves (Arbitrum, Base, Optimism, etc.) that finalize their states on L1. The higher the activity on L2, the more frequently they interact with the base layer.
-
Transaction Profile Shift (High-Value Only): L1 transactions have become more complex. Simple transfers have migrated to Layer 2, while complex interactions remain on Layer 1: RWA minting, large stablecoin transfers, and arbitrage.
The chart data refutes the fears that L1 will lose its relevance. On the contrary, the network is operating at the limit of its throughput (gas limit), and only the structure of demand has changed: from B2C (retail users) to B2B (L2 networks and institutions).
Daily active users
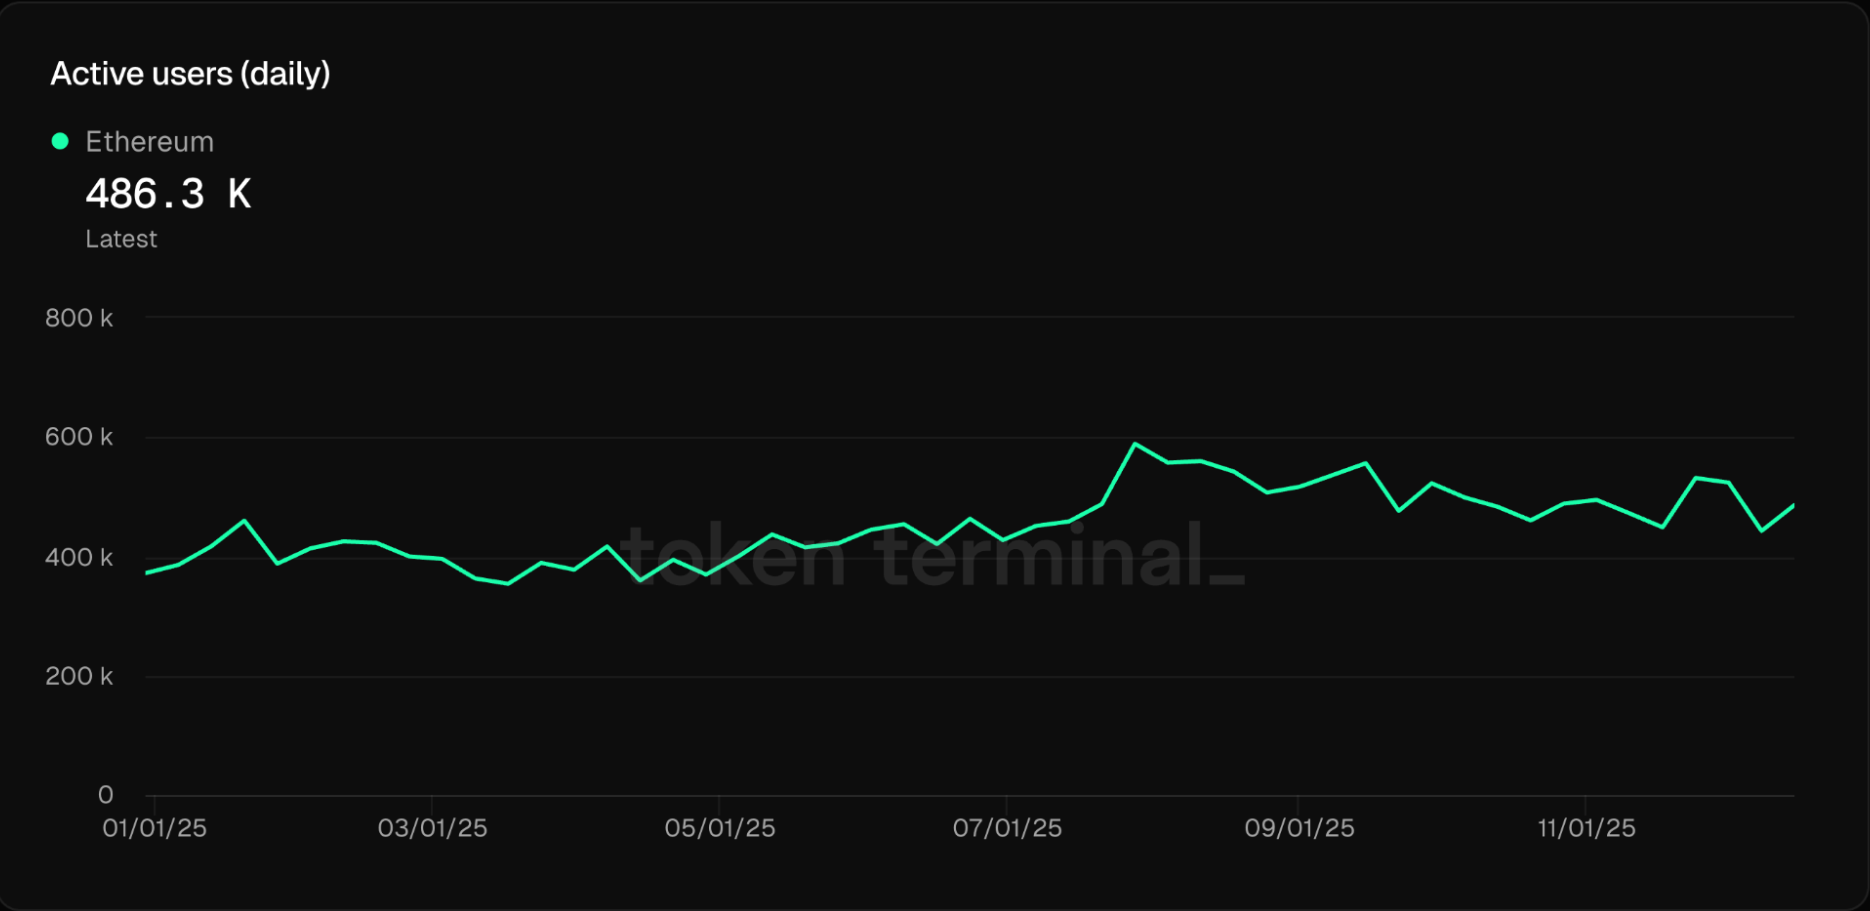
Source: tokenterminal
While the previous chart (Transactions) showed the increase in system load, the DAU (Daily Active Users) chart answers the question: "Who is behind this activity?"
The year began with 350k–400k active addresses per day. By year-end, the metric consolidated at the 450k–500k level. Given that the average retail user has massively migrated to L2 (Base, Arbitrum) for daily activity, the growth in addresses on L1 is likely driven by two major factors.
-
Institutional Activity and ETFs: New addresses on L1 are often not individuals, but custodial wallets of funds and custodians interacting with ETF infrastructure. For these actors, L1 security is critical, outweighing transaction costs or speed.
-
Rise of "Smart Accounts": The increase in addresses is linked to the adoption of Account Abstraction. Many "users" on the chart are smart contracts (wallets) that automatically execute operations.
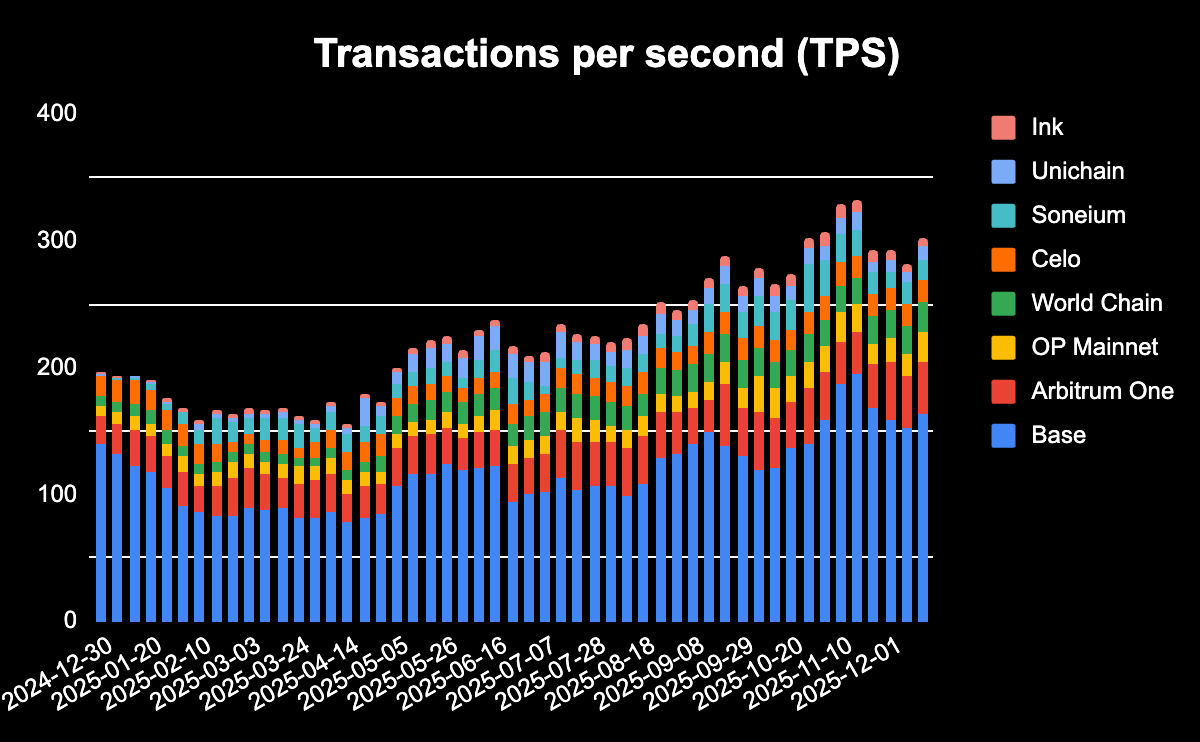
Source: tokenterminal
The chart above demonstrates organic growth in the throughput of Ethereum Layer 2 solutions. We observe a U-shaped recovery in activity: following a cooling period in the first half of the year (market correction), by the end of 2025, the ecosystem's aggregate TPS reached new all-time highs, surpassing the 300–330 transactions per second mark.
Key Growth Drivers
-
Base Dominance (Consumer Layer): The blue segment of the chart (Base) occupies a dominant position, generating over 50% of all ecosystem transactions. This confirms that the Coinbase network has become the de facto consumer gateway. This is where the bulk of mass-market consumer activity takes place.
-
The Second Wave: Corporate L2s (Q4 2025): Note the top right corner of the chart. In the final months of the year, the color spectrum expanded to include Ink (Kraken), Unichain (Uniswap), and Soneium (Sony).
-
Significance: This visualizes the institutional entry. While the first half of the year was dominated by general-purpose networks (Base, Arbitrum), the year-end marked the launch of specialized blockchains from FinTech and Tech industry giants.
-
-
The Celo Migration: The appearance of the orange segment (Celo) confirms the successful transition of this blockchain from a standalone L1 to an Ethereum L2. This sets a vital precedent: Ethereum is becoming the foundational security layer for former competitors.
The figure of ~300+ TPS strongly suggests that the L2 ecosystem has scaled Ethereum's base layer (15 TPS) by a factor of ~20. Moreover, unlike synthetic benchmarks, this represents "meaningful payload", i.e., real transfers and smart contract interactions.
Supply dynamics: the economics of scalability
Total supply change YoY
Source: beaconcha.in
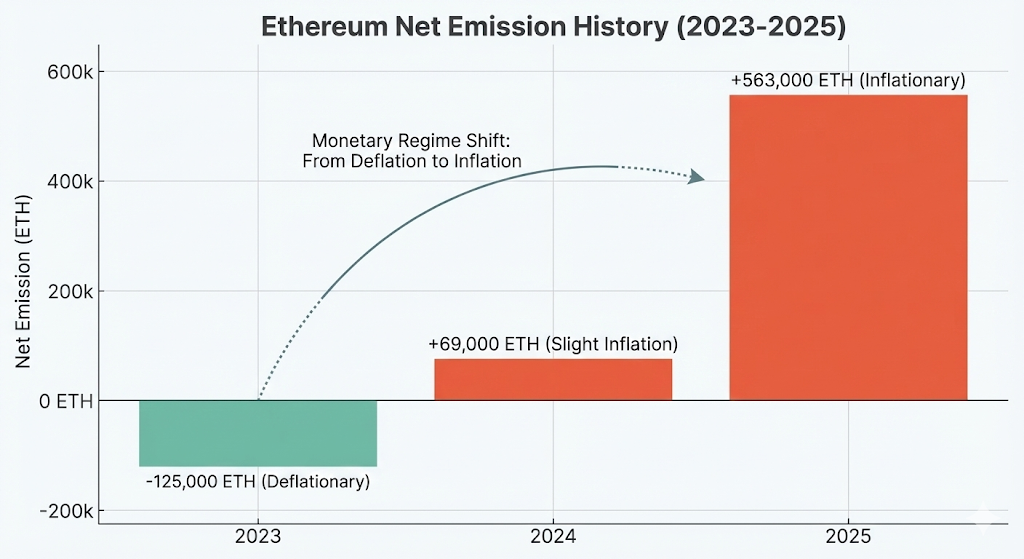
For clarity, we analyze the data over a three-year horizon. Visualizing Net Emission over this period shows a fundamental reversal in Ethereum's economy, which must be viewed in the context of the network's total capitalization.
-
2023: The "Ultra Sound Money" Era. The network burned 125,000 ETH more than it issued.
-
2024: Equilibrium Point. Minor inflation (+69,000 ETH), signaling the onset of structural changes.
-
2025: Return to an Inflationary Model. Supply growth totaled +563,000 ETH.
Scale Context (Total Supply Perspective): It is crucial to correctly interpret absolute growth figures. By the end of 2025, Ethereum's total supply reached ~122,608,000 ETH. Thus, an issuance of +563,000 ETH dilutes holder share by only 0.46% for the year. For comparison: given the current money supply, this inflation level is extremely low and virtually imperceptible to market liquidity, remaining significantly lower than fiat currency inflation (USD, EUR) and even Bitcoin (~0.85%).
Fundamental Drivers of the Trend Shift
The EIP-1559 mechanism burns the Base Fee when a block is full. Previously, L2 networks (Arbitrum, Optimism) were the largest consumers of block gas, creating constant pressure on the Base Fee and burning vast amounts of ETH. With the implementation of EIP-4844 (Proto-Danksharding) and its evolution in 2025, L2s migrated to dedicated, low-cost storage "blobs."
The activation of the Pectra upgrade in May sharply increased L2 network throughput by expanding the blob limit. This caused L2 data storage costs to drop to practically zero (1 wei). As a result, the Burn mechanism, which feeds on fees, slowed down significantly.
At year-end (December 3), the Fusaka upgrade was activated to rectify this situation in 2026.
-
EIP-7918 (Blob Fee Floor): The year's primary economic change. This standard pegged the minimum blob cost to the execution base fee. Now, even if blob demand is low, L2s are required to pay a "fair price" for security, guaranteeing stable ETH burning in the future.
-
PeerDAS (EIP-7594): Data sampling enables safe data scaling (up to 8x), transforming Ethereum into an efficient data layer for hundreds of new L2s.
The 2025 chart should not be interpreted as a tokenomics "failure." This is the price the protocol pays for scalability. Ethereum has shifted from a "Deflation via High Cost" model to a "Low Inflation for Mass Adoption" model. From a macroeconomic perspective, Ethereum remains "Hard Money," despite local supply growth.
Staking ecosystem: structural maturity & market segmentation
Total value staked
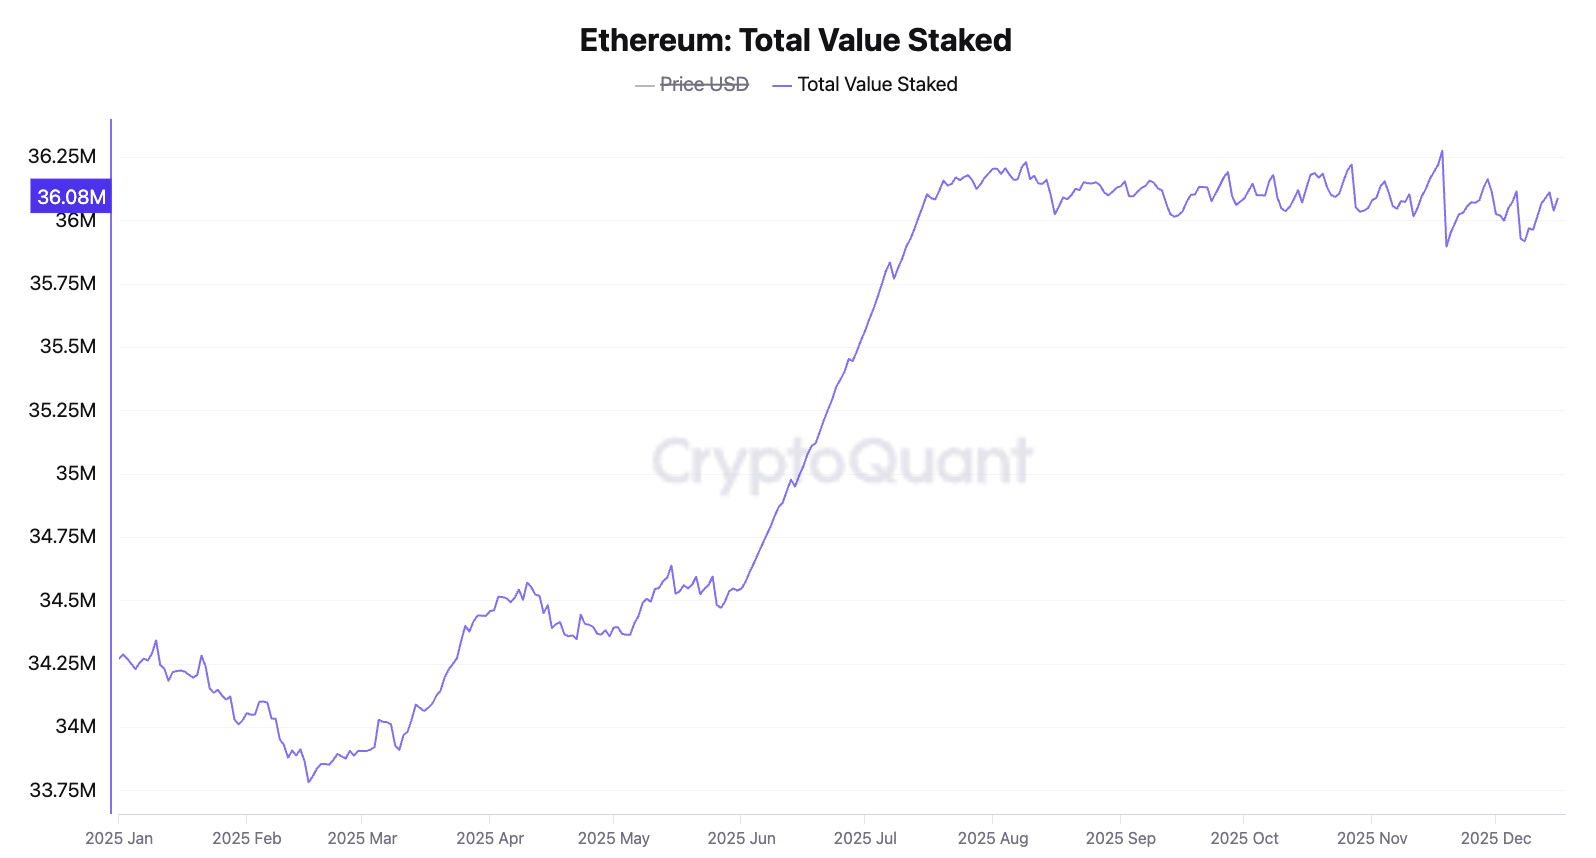
Source: CryptoQuant
2025 marked the staking market's transition into maturity. We no longer observe the exponential "vertical" growth characteristic of previous years, which may suggest that macroeconomic equilibrium has been attained.
-
Staking Ratio Dynamics: At the start of the year, 28% of the total Ethereum supply was engaged in network security. By year-end, this figure rose to 29.3%.
-
Absolute Values: The total volume of staked funds reached ~36.08 million ETH. Net growth for the year exceeded 1.8 million ETH.
The chart clearly highlights two key phases that defined the year's dynamics.
-
Technical Impulse (Q2 2025): The sharp rise in metrics during May-June directly correlates with the activation of the Pectra upgrade. Major institutional players prepared liquidity for the launch of new validator management features, resulting in an immediate capital inflow.
-
Economic Plateau (H2 2025): In the second half of the year, the curve stabilized. With the staking rate around 30%, the base yield (APR) compressed, naturally slowing the inflow of speculative capital. The market found an equilibrium point between liquidity in DeFi and security in staking.
Consolidated validators
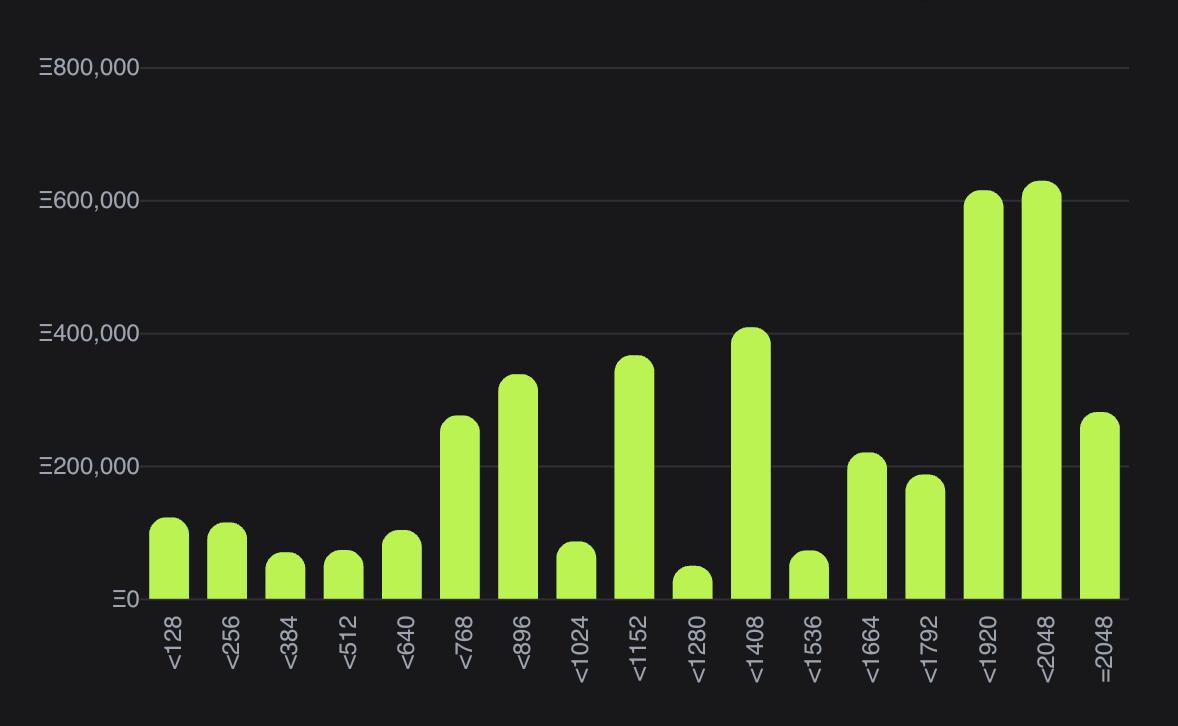
Source: Pectrified
The pivotal event of the year in staking architecture was the mass adoption of the Max Effective Balance (MaxEB) increase, implemented via EIP-7251. This upgrade enabled validators to raise the upper stake limit from 32 ETH to 2,048 ETH, radically transforming node management.
In our previous report, we noted the nascent stages of this technology: as of June 2025, validators with the new parameters (0x02 credentials) held approximately 750,000 ETH (~2% of the total stake). The second half of the year demonstrated explosive growth in the utilization of this feature.
Year-End Metrics
-
Number of Type-2 Validators: ~7,000.
-
Stake Volume: Collectively, they control over 4,000,000 ETH.
-
Dynamics: Over 6 months, the volume of ETH in consolidated validators grew 5.3x. This validator type now accounts for over 11% of all staked Ether.
The distribution chart shows a distinct shift in interest toward maximum values. The highest bars are concentrated in the 1,920–2,048 ETH range. This indicates that market participants managing large capital are systematically leveraging the protocol upgrade to optimize their infrastructure, pushing validator balances to the upper technical limit.
The growth in the share of consolidated validators from 2% to 11% in just six months is a sign of the ecosystem's technical maturity. The industry is shifting from extensive growth (thousands of new 32 ETH nodes) to intensive growth, thereby reducing the load on the Ethereum Consensus Layer.
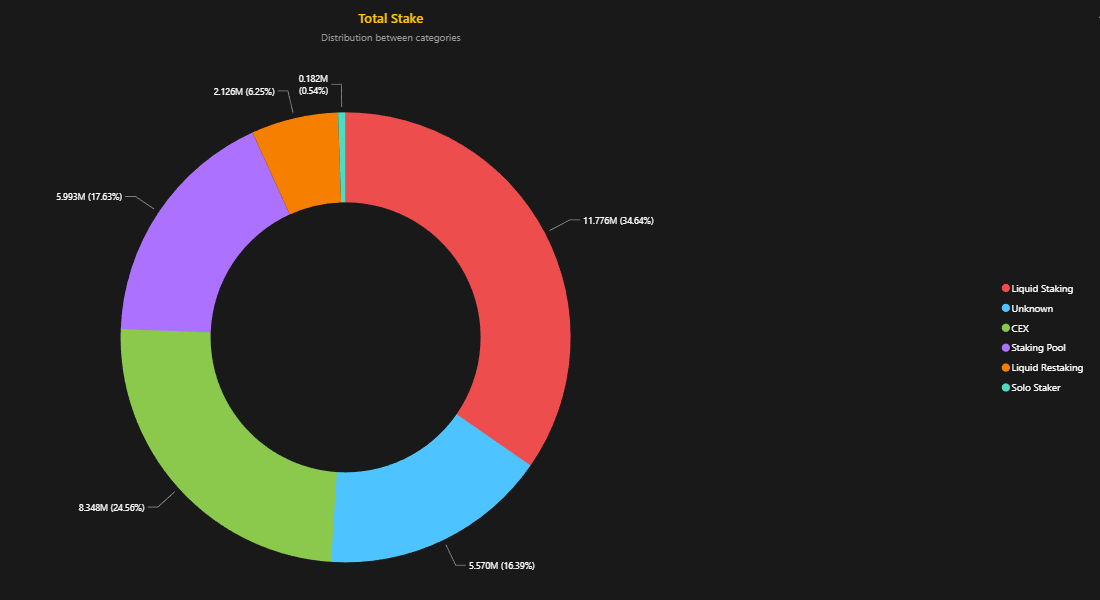
Staking distribution: the great rebalancing
The year 2025 marked the transition of the staking market from a phase of linear accumulation to structural segmentation, in which the dominance of general-purpose solutions (such as Lido) was complemented by the rise of specialized sectors.
We are observing a conscious capital rebalancing: conservative investors are increasingly migrating to regulated custodial services to meet compliance requirements, while speculative liquidity is flowing into restaking protocols and new LSTs in search of higher yields. This indicates not a crisis of established protocols, but the maturation of the industry, which now offers distinct tools for different risk profiles, ranging from institutional reliability to aggressive DeFi strategies.
The traditional LST protocol sector is experiencing a painful contraction. The category's share fell from 34.59% to 30.1%. In absolute terms, the sector lost over 1 million ETH.
-
Lido: The market leader lost approximately 1 million ETH in volume (dropping from 9.6M to 8.6M ETH).
-
Rocket Pool: The second-largest decentralized pool shrank from ~711k ETH to 584k ETH.
-
Mantle: Experienced a sharp decline, dropping from ~450k ETH to 83k ETH.
-
Frax Finance: Stake volume decreased from 115k to 78k ETH.
That said, the market leader is adapting its architecture to meet new demands. The primary technological response to stagnation was the Lido V3 upgrade and the introduction of the stVaults mechanic. This solution is targeted at institutional players requiring a balance between deep liquidity and strict risk control.
The essence of the upgrade lies in providing access to stETH liquidity via isolated repositories (stVaults) with clear role separation. Everstake became a strategic launch partner, acting as a trusted Node Operator for such vaults.
In this model, functions are strictly separated. Node operators manage staking, while risk curators independently define and enforce risk parameters like LTV thresholds, liquidation conditions, and exposure limits. This transforms staking into a TradFi-compatible product offering higher rewards and reduced risk, featuring a transparent division of operational and market risks.
Total Staked ETH by Category (as of year-start)
Source: Everstake's PowerBI
With the EigenLayer Mainnet fully operational, liquid restaking protocols (such as Ether.fi, which grew from 1.7M to 2.03M ETH over the year) offer a more capital-efficient model. Users are opting for complex strategies that add real yield from AVS (Autonomous Verifiable Services) to the base ETH rate, making classic LSTs (stETH, rETH) less competitive in terms of returns.
The Liquid Collective Case
Liquid Collective is an enterprise-grade solution supported by an alliance: Galaxy, Coinbase Cloud, Blockdaemon, Figment, and Staked.
In contrast with the general decline in the LST sector, the Liquid Collective (LsETH) protocol demonstrated anomalous growth, tripling its stake volume from 105k to ~300k ETH.
The explosive growth of LsETH correlates with outflows from Coinbase exchange balances. This confirms the hypothesis of institutional capital migration: major funds and corporations are moving away from custodial storage on exchanges (partly due to regulatory risks) but are choosing "white," fully compliance-compatible on-chain protocols.
Exchange Rotation: Binance vs. Coinbase
In the centralized provider (CEX) segment, leadership changed.
-
Coinbase lost approximately 1.5 million ETH (share dropped from 10.17% to 5.54%).
-
Binance increased volume from 2.02M to 3.14M ETH (share rose from 5.95% to 8.82%).
The market has clearly divided: American institutional capital is moving into regulated on-chain solutions (like Liquid Collective or ETFs), while global retail users are choosing Binance, likely for its simplicity and the integration of liquid wBETH into the exchange ecosystem.
All of the above strongly suggests that the era of "one-size-fits-all" solutions has likely passed. Now, there is a specific product for every investor group: Ether.fi for DeFi-active users seeking maximum yield, Liquid Collective for corporates prioritizing compliance, and Binance for the mass market.
Total Staked ETH by Category (as of year-end)
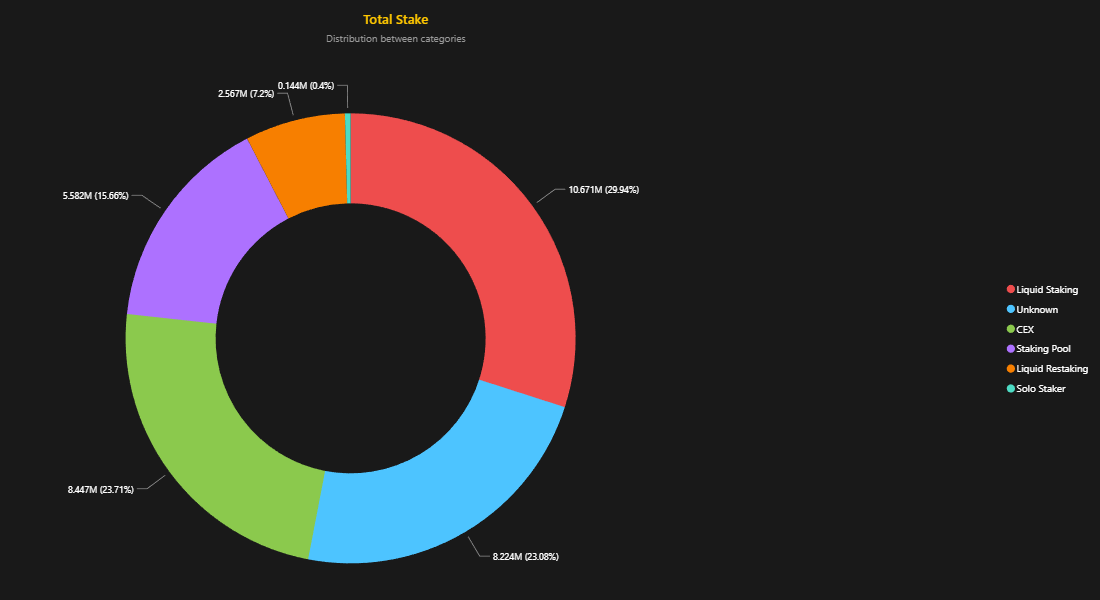
Source: Everstake's PowerBI
The financial layer: RWA and stablecoins
Ethereum continues its transition into a global settlement layer. We analyze this progress through two key categories: digital cash (stablecoins) and digital collateral (tokenized treasuries).
Stablecoin supply by network and token
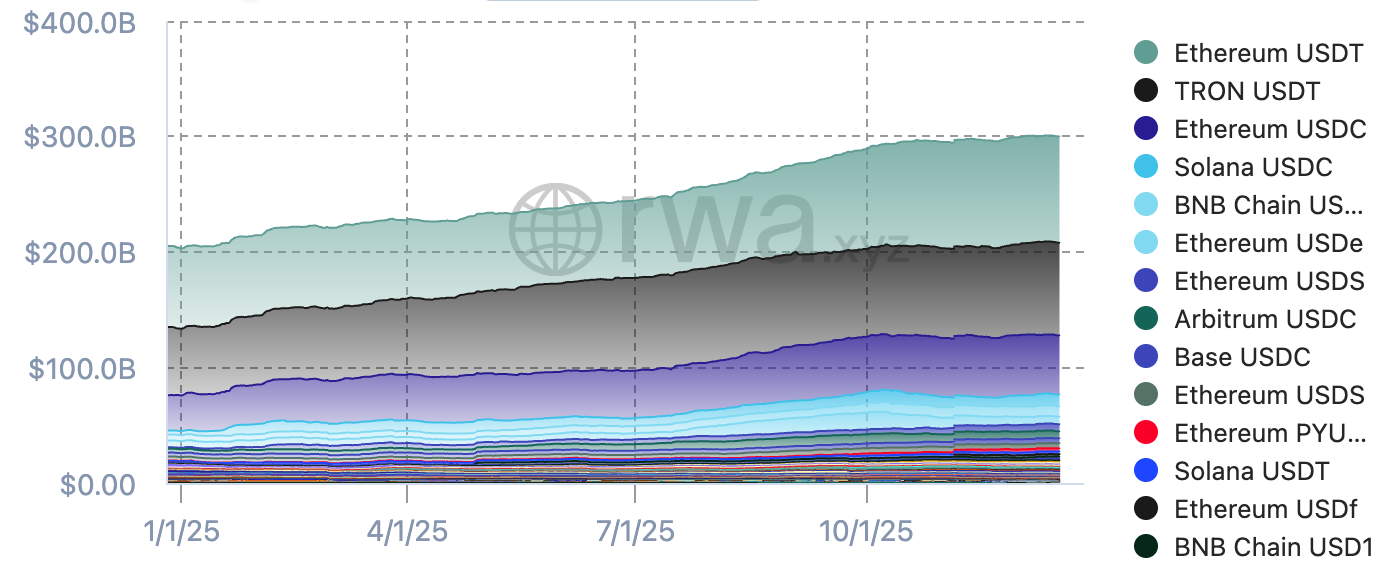
Source: rwa.xyz
The total supply of stablecoins across tracked networks has surpassed $300 billion. Ethereum (L1 + L2) remains the undisputed primary liquidity hub.
Ethereum and its L2s account for 61-62% of the total stablecoin market, representing approximately $184 billion of the $300 billion total. This constitutes the absolute majority of global on-chain liquidity.
While Ethereum USDT retains its dominant position by volume as the base asset for trading pairs, we are observing a critical structural shift toward USDC. The rising market share of USDC and other fully transparent stablecoins is a direct response to the new regulatory landscape. Clearer regulation in the U.S. and EU has bolstered market confidence. The implementation of frameworks like MiCA and legislative initiatives in the US has accelerated institutional interest. Big capital now prioritizes regulated instruments on the most secure network.
Unlike TRON, which is predominantly used for P2P transfers, stablecoins on Ethereum function as productive capital. They collateralize loans, deepen liquidity pools, and are deployed in complex on-chain strategies (including the rapidly growing USDe).
U.S. treasuries by network
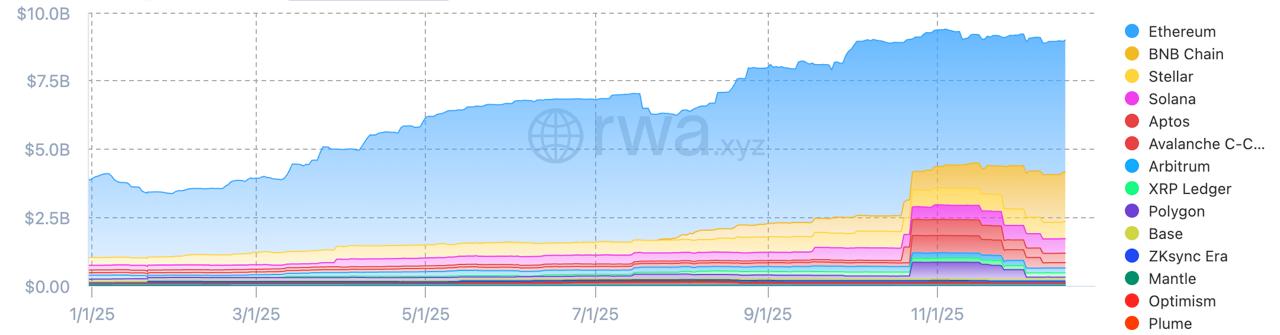
Source: rwa.xyz
In this context, U.S. Treasuries refer to tokenized short-term debt obligations issued by the U.S. government. They allow crypto investors to earn a stable "risk-free rate" directly on the blockchain.
The tokenized U.S. government debt sector is approaching $10 billion. Historically, the Ethereum Mainnet (blue zone) held a monopoly position. By the end of 2025, the Ethereum ecosystem's share (L1 + L2) corrected to approximately 57%. While this market is becoming multi-chain, Ethereum L1 remains the primary security anchor for the largest funds (BlackRock BUIDL, Franklin Templeton).
Ethereum in Global Finance: DATs, ETFs, and Corporate Adoption
In 2025, Ethereum definitively ceased to be viewed by institutions as merely an "altcoin." It has carved out a unique niche that we term a Yield-Bearing Strategic Asset. This is an asset class that combines the attributes of money (a store of value) and equity (generating cash flow through staking).
A new sector has emerged in public equity markets: DATs (Digital Asset Treasuries). Those are public companies whose core business model revolves around accumulating Ethereum. These are active holding entities leveraging Proof-of-Stake mechanics to drive shareholder value creation.
Cumulative ETH digital asset treasury holdings by public companies
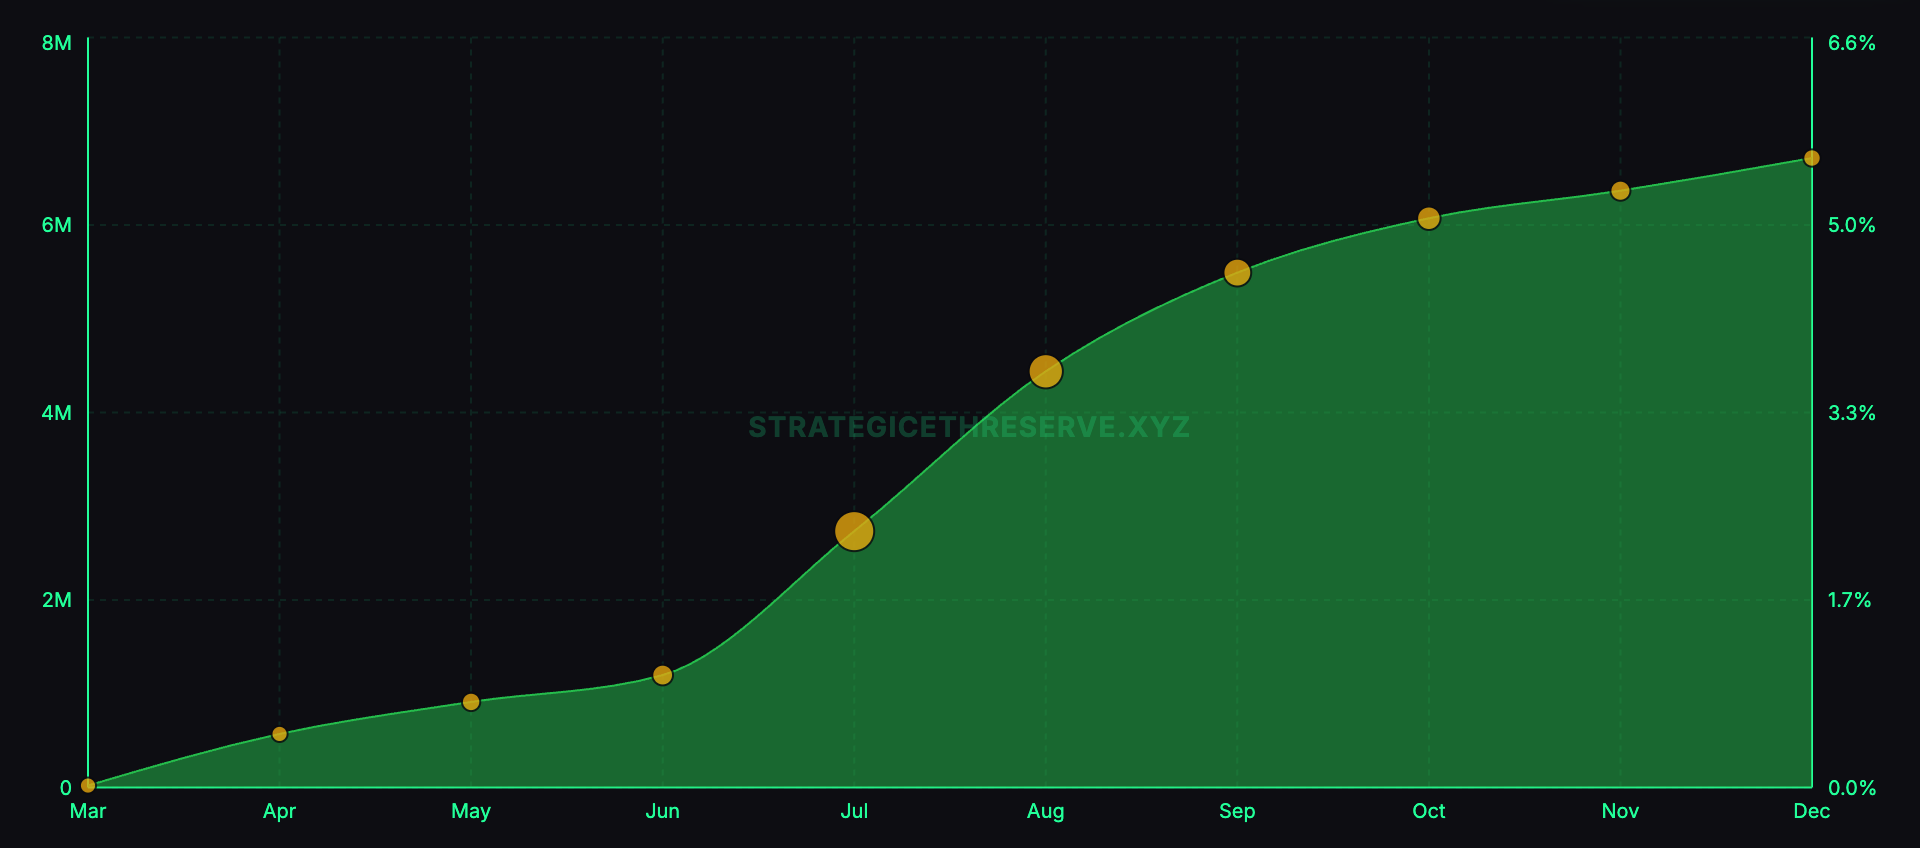
Source: Strategic ETH Reserve (SΞR)
A glance at the public company reserve accumulation chart reveals a classic "hockey stick" trajectory.
-
As recently as March 2025, corporate treasury volumes were negligible. Still, beginning in the summer, a parabolic surge occurred. By December, the aggregate ETH volume on public company balance sheets breached the 6.5–7 million ETH mark.
-
The right-hand scale indicates that public companies now control over 5.5% of Ethereum's total circulating supply. This creates a liquidity deficit in the open market (supply shock).
This explosive growth is driven primarily by three giants, each representing a distinct stage in the evolution of the DAT business model: BitMine Immersion Technologies, SharpLink Gaming, and The Ether Machine.
1. BitMine Immersion Technologies (BMNR)
The sector's "heavyweight," driving the bulk of the volume on the chart.
-
Strategy: Maximum asset accumulation. The company currently holds approximately 4 million ETH (a significant portion of the 6.5 million total).
-
Plans: Management has officially announced a shift to the next phase in early 2026. They plan to initiate staking of their reserves via their own infrastructure, the Made in America Validator Network (MAVAN), thereby transforming them into one of the network's largest validators.
Update: In late December 2025, it was revealed that BitMine had already commenced staking Ethereum from its reserves via third-party infrastructure. According to public statements, hundreds of thousands of ETH are currently staked. This move is viewed as an interim step before the launch of the proprietary MAVAN validator infrastructure, scheduled for early 2026.
2. SharpLink Gaming (SBET)
A company successfully implementing an active treasury management strategy.
-
SharpLink holds approximately 860,000 ETH and actively staked it.
In its quarterly reports, the company records staking rewards as operating income. These funds remain on the balance sheet, expanding assets and creating a "safety cushion."
3. The Ether Machine (ETHM)
A new player (ticker: ETHM), demonstrating the most aggressive capital efficiency model.
-
Approximately 496,000 ETH under management.
-
Unlike some competitors, Ether Machine keeps 100% of its reserves staked. In October 2025, the company officially reported generating 1,350 ETH in net yield for a single reporting period.
-
The company utilizes proprietary validator infrastructure, eliminating intermediaries. This avoids Management Fees and maximizes Net Yield for shareholders.
Investors are likely to choose these stocks over buying ETH directly because two financial mechanisms create a leverage effect.
-
mNAV (Market Net Asset Value) Arbitrage: If a company's stock trades at a premium to its assets' value (mNAV > 1.0), it can issue additional shares. The proceeds ("expensive" dollars) are used to buy more Ether. As a result, the amount of ETH per share increases even for existing shareholders (an accretive transaction).
-
Example: If $10 of ETH is "embedded" in one share, but the market is willing to buy that share for $15, the company sells the share, buys $15 worth of ETH, and thereby increases the backing of every share. This is the "infinite capital loop" popularized by Michael Saylor, now applied to ETH.
-
-
Accretive Yield: Unlike BTC miners who deplete capital on equipment (CAPEX), DAT companies generate staking yield (~3% APY) with minimal expenses.
The ETH balance grows automatically. Since the company does not pay dividends but reinvests earnings, the ETH per share metric continues to rise. The investor owns a stake in a company that effectively becomes ~3% richer every year "out of thin air."
Bitmine Immersion Technologies, Inc. (BMNR) Stock Price
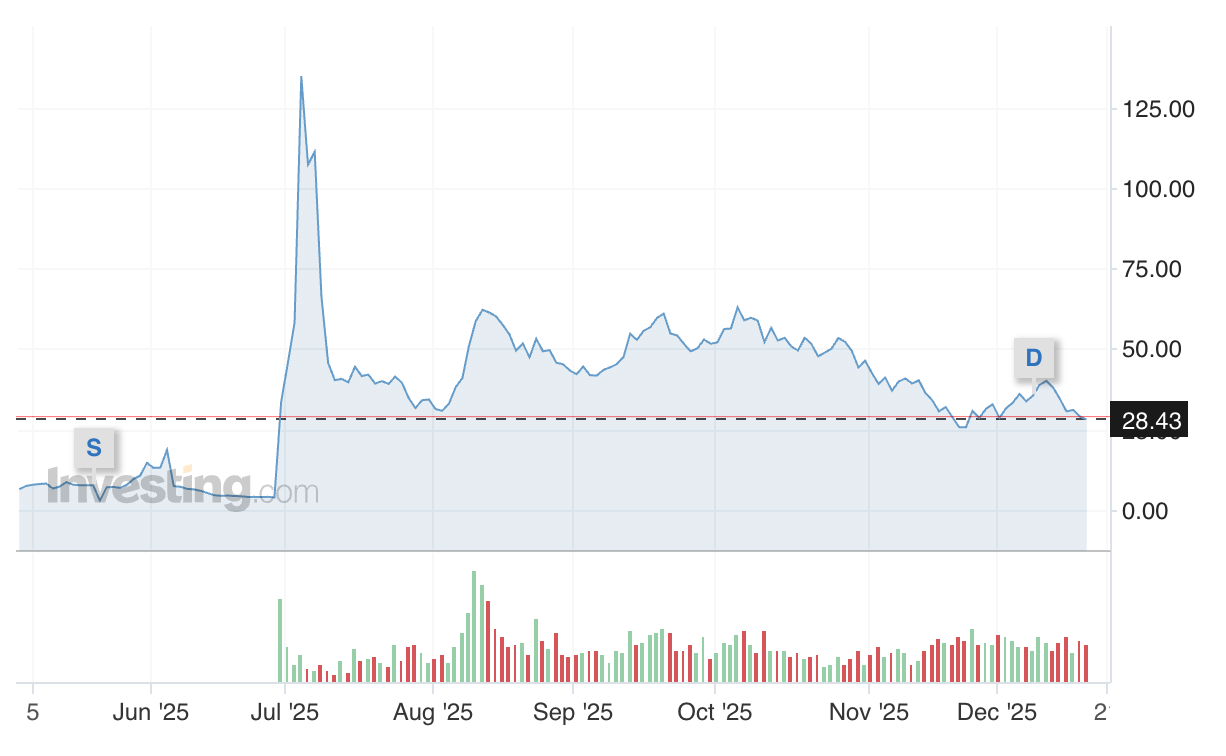
Source: Investing.com
The stock chart of the sector leader, BitMine Immersion Technologies (BMNR), provides a sufficiently clear answer to the question of how the stock market values their strategy.
-
In July 2025, in sync with the announcement of the transition to the "Ethereum Treasury" strategy, the share price went vertical, soaring from ~$5 to a peak above $130. The market instantly repriced the company, pricing in the future value of the accumulated Ether.
-
The hype phase was followed by an expected correction and stabilization in the $28–30 range.
It is crucial to note that the charts of all three key players (BitMine, Ether Machine, SharpLink) demonstrate an identical structure: Explosive Growth post-announcement → Retracement → Flat. This suggests that the market is currently in a phase of price discovery for this new asset class, balancing between initial hype and the fundamental Net Asset Value (NAV).
Spot Ethereum ETF AUM
For the ETF sector, 2025 proved to be a year of extreme volatility, perfectly correlating with the price action of the underlying asset. We distinguish two key phases on the chart.
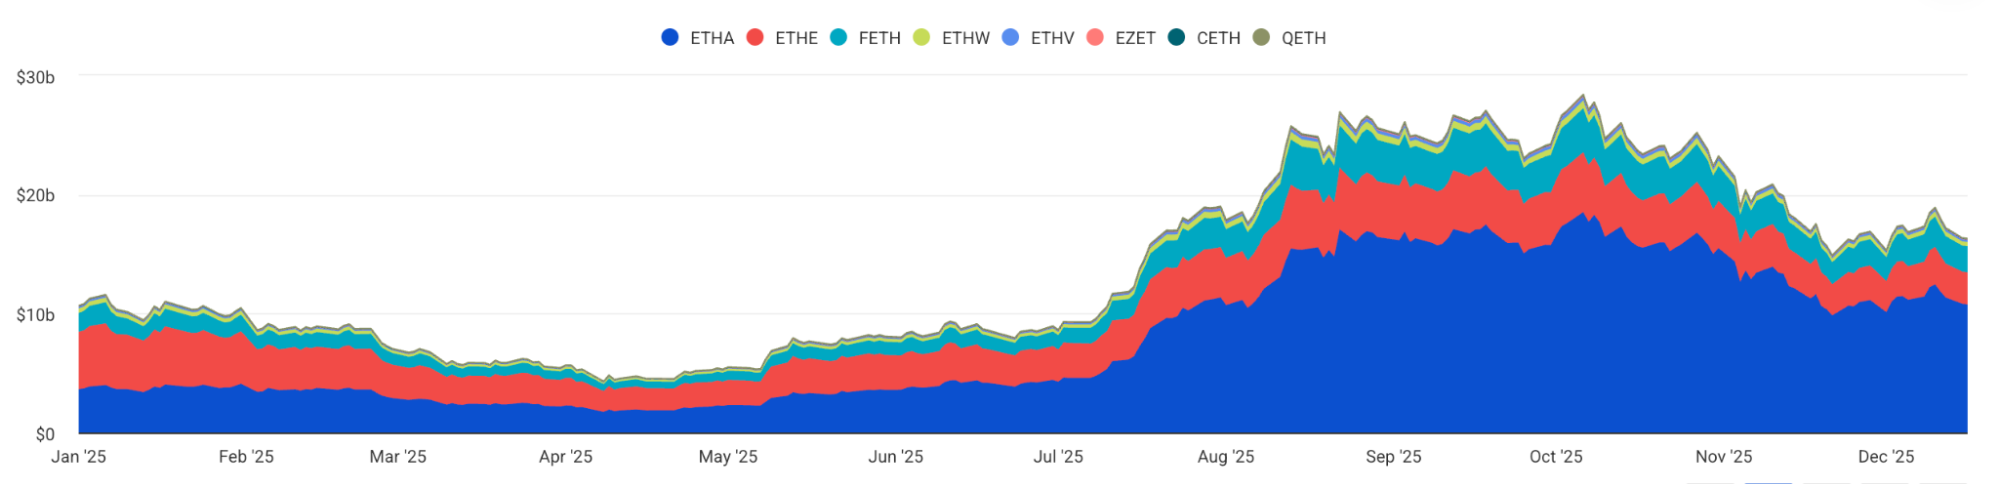
Source: The Block
Phase 1: Macro-Correction (January – May). The beginning of the year was marked by a dramatic decline in Assets Under Management (AUM) from ~$11 billion to lows around $5 billion by May.
-
This drop was not driven by structural issues within the ETFs themselves, but by a deep correction in the broader market. During this period, the price of ETH trended downward (hitting local lows near $1,500), which automatically "deflated" the dollar valuation of fund portfolios.
-
Against a backdrop of a falling market, we observed moderate net outflows: investors were exiting risk assets, realizing losses, or waiting out volatility in stablecoins.
Phase 2: V-Shaped Reversal (June – December). The turning point came in the summer. Starting in June, the chart demonstrates vertical growth, reaching an all-time high of ~$29 billion by year-end.
-
The recovery in Ethereum's price acted as a catalyst for the return of liquidity. Once the trend shifted to bullish, institutions began aggressively building positions.
-
The blue zone on the chart (ETHA by BlackRock) holds a dominant position. BlackRock effectively monopolized new capital inflows, cementing itself as the primary entry point for Wall Street.
Product Evolution: The U.S. Catches Up
It is important to note the context: spot ETF trading in the U.S. commenced back on July 23, 2024. Yet, throughout 2024 and early 2025, these products offered only non-yielding price exposure.
-
In Canada and Europe, investors had access to staking within ETPs as early as 2024.
-
A major step in the development of the US market was the approval of staking for Grayscale products in 2025. While this was not the sole driver of growth, the introduction of Yield made holding ETFs significantly more attractive to long-term allocators, reducing the incentive to exit positions during future corrections.
The 2025 AUM chart proved that ETFs function exactly as intended: they serve as a liquidity conduit. When the market falls, ETFs contract, and when the market rises, ETFs act as a multiplier, accelerating capital inflows through the regulated channels of BlackRock, Fidelity, and others.
Institutional flows
Ethereum ETF Net Flow
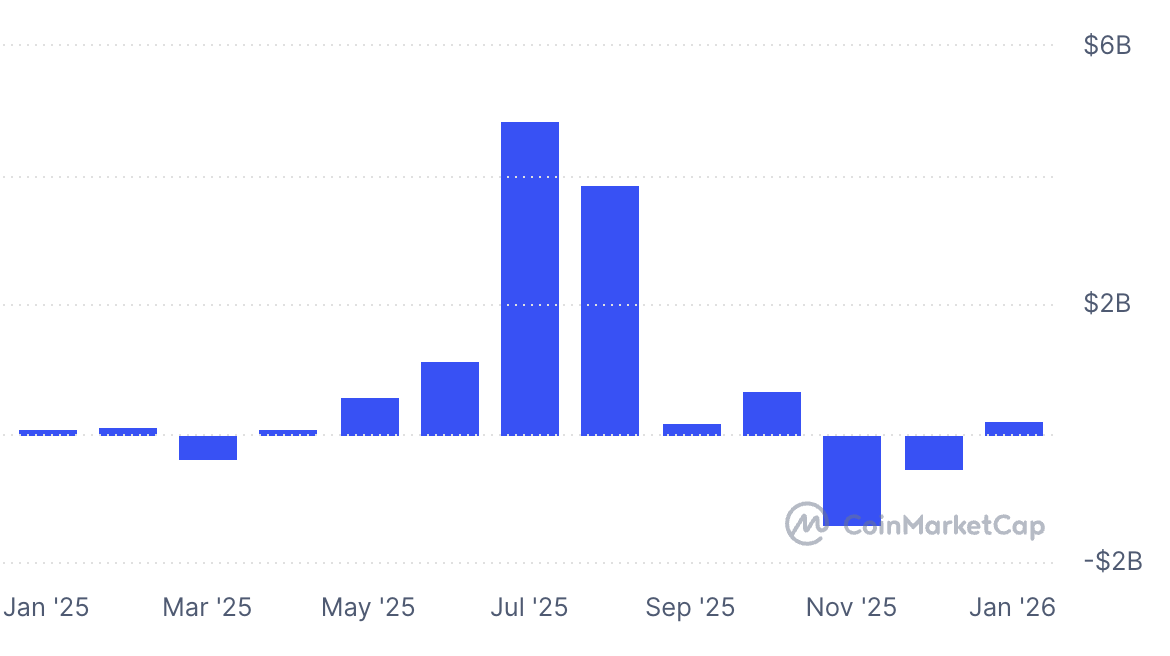
Source: CoinMarketCap
Simultaneously, the cryptocurrency market is witnessing growing institutional interest. In July 2025, cumulative inflows into spot cryptocurrency ETFs surpassed $11 billion, encompassing both Bitcoin and Ethereum. Of this total, ~$6.2 billion was allocated to BTC and ~$4.9 billion to ETH.
Still, large-scale exits or the unwinding of complex strategies (e.g., structures that rely on borrowing ETH or staking as collateral) can create temporary selling pressure, masking long-term fundamental trends. Such capital movements are particularly pronounced during periods of heightened market uncertainty and shifting risk appetite.
Ethereum adoption by institutions
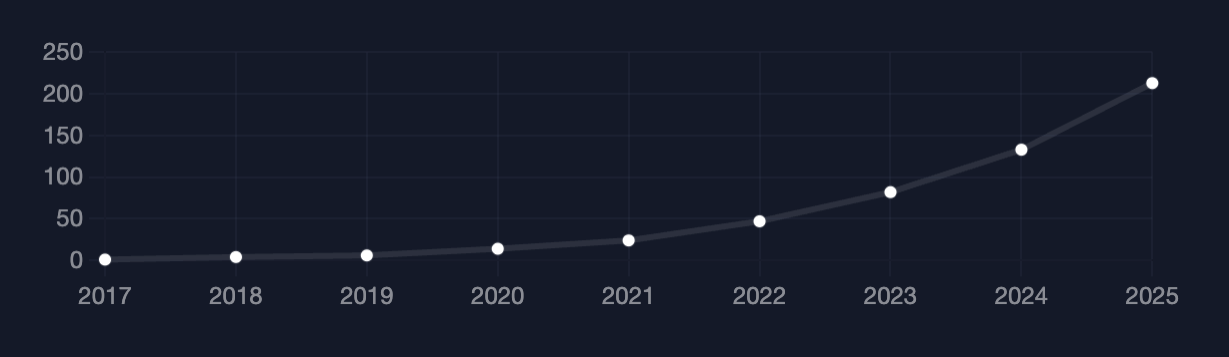
Source: ethereumadoption
In 2024, 51 new implementations were recorded, a significant portion of which comprised pilot marketing and consumer use cases: mass NFT campaigns, gaming, and brand-focused launches (e.g., Atari initiatives, early Robinhood consumer products, and other experimental integrations).
In 2025, the number of new entities grew to 80, but the adoption profile itself fundamentally shifted: the share of promotional cases declined, while the number of practical launches in finance, payments, and infrastructure surged. While consumer projects from Ubisoft, Sony, LINE, and Opera persist, they no longer constitute the primary growth driver.
Simultaneously, the technical approach to Ethereum adoption has evolved. Whereas corporations previously relied primarily on the shared L1, 2025 marked a transition toward launching proprietary Layer-2 solutions on top of Ethereum. The activation of dedicated networks such as Memento L2 (Deutsche Bank), Jovay L2 (Ant Digital), and Robinhood Chain reflects a shift from experimentation to the systemic utilization of Ethereum as a base settlement layer.
Collectively, these changes imply that Traditional Finance (TradFi) has completed testing and moved to industrial-scale operations, integrating Ethereum and its L2 infrastructure directly into its balance sheets and operational workflows.
The price of maturity: centralization risks and economic identity
The flip side of institutionalization
In 2025, Ethereum faced a new breed of challenges. The primary threat no longer stems from external competitors, but from an internal conflict of interest precipitated by the massive influx of large-scale capital.
"Soft Power" and Technical Lobbyism. In November 2025, Vitalik Buterin issued a stark warning regarding the rising influence of giants like BlackRock and Circle. The concern was about a fundamental divergence of values.
-
The Ethereum community prioritizes credible neutrality, censorship resistance, and the ability to run nodes on consumer hardware.
-
DATs/ETFs (Wall Street) prioritize predictability, regulatory compliance (OFAC), and maximum settlement speed.
The risk lies not in a classic 51% attack (which is too expensive and obvious), but in a more subtle one: large players may lobby for protocol changes that favor corporate efficiency at the expense of decentralization.
-
Buterin cited a specific potential demand: reducing block times to 150 milliseconds to meet the needs of High-Frequency Trading (HFT).
-
Such speeds would require industrial-grade data centers and bandwidth accessible only to major providers. Home staking would become physically impossible, turning the network into a closed club of banking servers and stripping it of its censorship resistance properties.
Innovation paralysis
With hundreds of billions of dollars locked in ETFs and RWAs, the cost of any code error becomes unacceptable for institutional actors.
-
Large stakeholders may begin lobbying to block complex upgrades (e.g., L1 ZK-EVM implementation) out of fear of bugs.
-
Ethereum risks falling into a trap of premature stagnation. It could become a static system unable to scale, while competitors race ahead through greater flexibility.
"Single client crisis" (client diversity) and the Prysm incident
Despite EF efforts, institutional stakers tend to herd toward the same software for "proven stability," creating a single point of failure. This was vividly demonstrated by a year-end incident.
In early December, the Prysm consensus client encountered a bug (resource exhaustion processing specific attestations).
-
Validator participation dropped to ≈75% over a ~42-epoch window.
-
Approximately 248 blocks were missed (~18.5% of slots in the affected window).
-
Validators lost ≈382 ETH in rewards (over $1 million at the time).
While the risk is real, Ethereum still maintains more independent client implementations than most L1s (Bitcoin >90% Core; Solana historically relied on a single client until Firedancer). Ethereum boasts diversity on both layers (EL: Geth, Nethermind, Besu, Reth; CL: Lighthouse, Prysm, Teku, Lodestar). That said, practical market share remains concentrated (e.g., Geth ≈47% EL, Lighthouse ≈48% CL), preserving the risk of systemic impact from bugs in popular clients.
Price does not reflect development
In 2025, the key economic challenge for Ethereum was the significant weakening of the deflationary effect previously driven by burn mechanisms.
The post-Merge economy was built around EIP-1559, which combined burning base fees with PoS to reduce net issuance. Yet, this effect was contingent on network activity levels.
-
With the Dencun and Pectra upgrades (2024-2025), the network implemented blobs (EIP-4844), a dedicated, low-cost data storage for Layer-2 networks (Arbitrum, Base). This system slashed L2 data publication costs by 90%+, drastically reducing L1 base fees.
-
The drop in base fees led to a collapse in burn rates: in Q1 2025, the daily burn hit historic lows (~50-70 ETH/day), and year-over-year net supply dynamics returned to an inflationary model, albeit with issuance remaining very low by historical standards.
Finally, in December 2025, the Fusaka upgrade introduced EIP-7918 (Blob Base Fee Bound). It established a minimum price for blobs to ensure a sustainable stream of base fees is burned even during low L1 activity. The update was designed to return Ethereum to a neutral or deflationary range during active usage, though the market is still waiting to see this materialize in practice in 2026.
Macroeconomic factors
Cryptocurrency prices, including ETH, were heavily influenced by broader economic factors throughout 2025:
-
Central Bank Interest Rate Policy: Rate cuts, expectations of Federal Reserve easing, and inflation uncertainty significantly impacted investor risk appetite and the correlation between crypto and traditional assets. For instance, Bitcoin's rally to ~$92,000 and Ethereum's responsiveness to expected Fed rate cuts in December 2025 reflected this strong linkage.
-
Market Uncertainty Levels: Analysts noted that uncertainty regarding stagflation, inflation, and monetary policy created a "risk-off" environment. In such conditions, risk assets like cryptocurrencies often declined or exhibited high volatility, independent of fundamental protocol developments.
The challenge of positioning Ethereum among other crypto assets
Ethereum occupies a distinct position compared to other major cryptocurrencies.
-
Bitcoin is perceived by institutional investors primarily as a store of value or "digital gold", i.e., an asset for preserving wealth with high resilience to correlations and strong capital inflows. This narrative is reinforced by data showing the increasing role of Bitcoin ETFs in traditional portfolios.
-
Ethereum, as a smart contract ecosystem and infrastructure asset, is viewed with a more B2B orientation. While it has a broad spectrum of applications, it often lacks the "clear-cut" price appreciation history that appeals to retail investors.
-
Solana and certain other platforms attract active retail participants through ultra-low fees, high throughput, and a rapidly growing DeFi/meme market. This creates a separate market narrative for them, closely tied to retail engagement.
Ethereum effectively finds itself caught between two market narratives: the strong institutional perception of Bitcoin and the more "gamified" or retail-centric models of Solana, which attract a different segment of market participants.
Everstake's strategic partnerships and ecosystem milestones
2025 became a year of infrastructure scaling through key partnerships. Collectively, over 330,000 ETH have been staked via our 0.1+ ETH Staking Solution integrated by partner wallets.
-
Trezor (Hardware Wallet): The highlight for this industry pioneer was the launch of the Trezor Safe 7, a next-generation device featuring enhanced security and a tactile interface. In partnership with Everstake, Trezor demonstrated phenomenal growth: staking volume via the Everstake operator reached ~230k ETH, nearly doubling the previous year's figures (~120k ETH). This suggests user confidence in the combination of "cold" storage and non-custodial staking.
-
Exodus (Desktop and Mobile Wallet): This year, the partner's focus shifted toward expanding its infrastructure product, XO Swap. A key driver was the integration with MetaMask, which unlocked access to XO Swap for millions of new users, enabling them to access superior exchange routes. For instance, in September and October 2025, XO Swap accounted for ~37% of the "exchange provider processed volume" within the Exodus ecosystem.
-
OneKey (Open Source Hardware Wallet): In 2025, OneKey successfully closed a Series B funding round, securing a $150 million valuation led by YZi Labs. These funds are allocated to expanding R&D and enhancing the security of devices that now natively support staking via Everstake.
-
Zengo (MPC Wallet): In 2025, the company reached a new level of corporate maturity by achieving ISO 27001 information security certification and launching Zengo Business for institutional clients. Furthermore, Everstake and Zengo executed a successful joint staking incentive campaign ("Stake $1000 in ETH, Get $50"), attracting a new wave of investors to the protocol seeking MPC-level security.
We integrated our staking solution into three major wallets.
-
Coca Wallet (MPC/Card): An innovative wallet featuring crypto cards.
-
Coin98 (Super App): The leading DeFi application in Southeast Asia.
-
ImToken: Asia's largest non-custodial wallet. Together with ImToken, Everstake launched a massive marketing campaign that unlocked staking access for millions of users in the East.
We also continue our fruitful collaboration with CoinWallet, which remains a reliable staking entry point for its user base.
The road ahead: 2026 upgrades, institutional growth and quantum resilience
Glamsterdam (EL - Amsterdam, CL - Gloas) is the next major Ethereum upgrade, which the community worked towards in 2025 with a target horizon of H1 2026. The upgrade groups several key EIPs and is primarily aimed at increasing L1 throughput and streamlining block construction mechanics.
-
EIP-7732—Enshrined Proposer-Builder Separation (ePBS): This involves moving part of the interaction logic between validators-proposers (those proposing blocks in their slots) and external block builders directly into the protocol. In practice, this means that processes currently performed "off-chain" via MEV-Boost (external relays and builders paying proposers for payload) will gain formal protocol interfaces and rules. In other words, instead of a fully off-protocol "builder → relay → proposer" market, ePBS introduces standard protocol mechanisms for payload exchange and payments, offering greater transparency and unified rules for participants. This changes the game for the builder/relay market but does not "eliminate" MEV itself.
-
EIP-7928—Block-Level Access Lists (BALs): BALs allow blocks to pre-specify which accounts and state slots will be read/written. This enables clients to safely perform parts of validation and execution in parallel, reducing block processing time and increasing practical execution throughput. At the operator level, this means more efficient slot usage and the ability to "fit" more useful work without a proportional increase in validation time.
Glamsterdam does not yield an instant rise or fall in returns, yet it restructures the block production economy. BALs and other EL improvements boost practical throughput, which, given activity growth, may increase total network fees. ePBS changes payment distribution rules: flows currently routed via MEV-Boost (external builders/relays) will acquire formal protocol interfaces.
This alters the channels and transparency of revenue distribution between validators, builders, and relays, but does not destroy the revenue sources themselves. For staking providers, this implies a more predictable and formalized block economy model, as well as the necessity of monitoring exactly how protocol payments will be structured.
Risks and market effects
The relay and builder market will likely persist, but enshrinement (formalization within the protocol) may raise entry barriers. Certain discussions included requirements/guarantees for builders, which would increase capitalization and operational demands for some participants. This could potentially reduce the number of small builders and intensify competition among those willing to invest in the necessary infrastructure. The effect is mixed: for the network, a plus in transparency and security, but for the competitive scene, a potential barrier for part of the market.
Hegota and FOCIL
FOCIL (EIP-7805) did not make the cut for Glamsterdam by the end of 2025 and was deferred for further development. The target venue for discussion is the next cycle, Hegota. Hegota is currently in the planning stage, and the meta-EIP for this cycle in the "Considered for Inclusion" section currently highlights primarily one candidate, EIP-7805 (FOCIL).
FOCIL proposes a protocol mechanism for inclusion lists: a method where a set of transactions is guaranteed inclusion in a block via fork-choice rules. This enhances censorship resistance and gives validators a tool to resist forced inclusion when dominant builders/relays refuse to include transactions. The idea has been discussed repeatedly in the community and has gone through several iterations of debate and postponement. It is currently being refined and considered specifically in the context of Hegota.
The new standard for institutional staking
By 2026, the institutional strategy for Ethereum has changed: passive holding is no longer enough. Major asset managers now realize that simply keeping ETH in cold storage means missing out on value. Staking has evolved from a niche option into a financial necessity—the standard way to preserve asset value against inflation. Consequently, the focus has shifted from simple custody to active management, where assets are put to work to generate reliable yield.
To do this safely, institutions demand integrated platforms that combine security, staking, and reporting. This is now supported by clear regulations like MiCA in Europe and improved clarity in the US regarding technical infrastructure. As these operational and legal barriers fade, we expect this trend to accelerate throughout 2026. This maturity will unlock a significant wave of new institutional capital, solidifying staking as a permanent fixture of the global financial landscape.
Quantum resistance: what it is and why it matters
Modern blockchains are secured by cryptographic "locks" such as public keys and digital signatures. Theoretically, a sufficiently powerful quantum computer could render these locks vulnerable: it could derive a private key from a public one, enabling an attacker to sign transactions with another person's funds. Even if such computers do not yet exist in a practical form, the "harvest now, decrypt later" threat is real: an attacker can record encrypted data today and decrypt it later when the technology matures. Consequently, many in the industry consider it essential to plan for a transition to methods resistant to both classical and quantum attacks.
-
Hybrid Signatures: Every transaction is signed using both the legacy and the new (quantum-resistant) schemes simultaneously. This provides "dual assurance" and allows for testing in real-world conditions without breaking backward compatibility.
-
Phased Account Migration: Through smart contract adapters and account update mechanisms, users gradually transition their signature methods. This mitigates the risk of mass asset loss during the migration process.
-
Threshold and Multi-Signatures for Institutions: For exchanges and providers, it is prudent to use schemes in which a signature is generated by a group of participants. In this model, compromising a single key does not yield full control over the funds.
-
Algorithm Selection and Standardization: Emerging international standards provide viable candidates for implementation. Each option presents trade-offs regarding signature size and network load (gas costs), making extensive testing and comparison critical.
The Ethereum community and research centers are already conducting reference implementations and tests. With international standards now ready for practical application, the discussion is shifting from "theory" to an "actionable roadmap." A full transition will require time, coordination, and testing. Thus, the rational course involves phased preparation and experimentation within testnets.
Conclusion
The year 2025 became a point of no return: Ethereum definitively ceased to be merely a technological experiment and reinforced its status as a Global Settlement Layer, adopted onto the balance sheets of the largest financial institutions and government entities.
Despite the temporary dissonance between fundamental growth and market valuation, the network demonstrates unprecedented maturity, with staking firmly cementing its role as the central pillar of the architecture of trust. The validation ecosystem has grown from simple pools into a sophisticated market of specialized institutional strategies and sovereign reserves.
In parallel, Layer 2 solutions effectively served as a high-performance environment for mass activity, allowing L1 to focus on security and finalizing large capital flows.
With the upcoming Glamsterdam and Hegota upgrades, Ethereum is expected to translate these infrastructure triumphs into sustainable economic sovereignty, where professional staking remains the foundation of the renewed global financial system.
Sign Up for
Our Newsletter
By submitting this form, you are acknowledging that you have read and agree to our Privacy Notice, which details how we collect and use your information.